October 19, 2026·21 min read
One 503, 64 Seconds: What S3 Adaptive Retries Really Cost
By Gabor Somogyi, Apache Flink PMC member
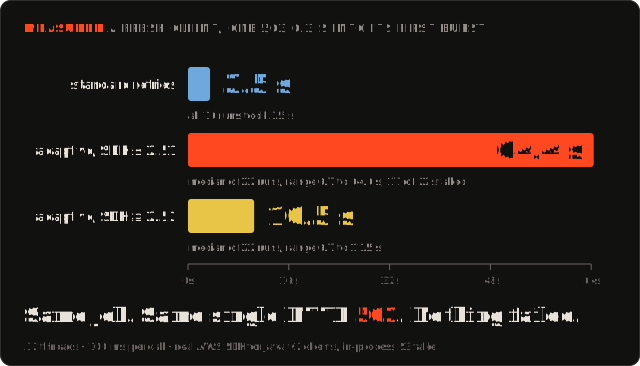
In my test rig, a burst of 1,000 S3 calls from 32 threads takes about three seconds. Let S3 answer one of them with 503 SlowDown. With standard retries the burst finishes in 3.5 seconds. With adaptive retries it took 64 in 17 of 22 runs, and 7 to 12 in the other five. Nothing failed. Nothing was down. A feature built to protect S3 (and your job) stalled a burst of 32 threads for a minute.
That is the starkest number I found, because it takes only one 503, and it is not a quirk of my rig: it falls out of the SDK’s own limiter code when a fresh client meets its first 503. AWS reworked that limiter in SDK 2.52.0 (August 2026); its changelog calls the old behavior “overly aggressive” and “unstable”. The same burst now takes about 10 seconds (7 to 11.5 over 22 runs). Better, and still three times slower than standard. “Unstable” fits what I saw: repeated runs of the same test on the old limiter gave very different results, so wherever the spread matters I quote the median and the range of all runs, not a single measurement.
This post is for anyone who has to trade throughput against stability in a data pipeline: checkpoint uploads, micro-batch commits, compaction, ingestion. I measured what adaptive retries cost on real SDK clients, before and after the fix, and what they buy in return. The rig: real AWS SDK for Java v2 S3 clients, about 100 ms per call, with S3 replaced by an in-process fake that answers 503 on command. More on that at the end.
The short version
| Your S3 traffic | What adaptive adds over standard |
|---|---|
| No 503 at all | Nothing. Identical throughput. The strategy costs 0.12 microseconds of CPU per call on one thread, 2 to 7 microseconds with 8 to 32 threads in a tight loop |
| Steady traffic, a 503 now and then (10 s or more apart at 80 calls/s) | Nothing measurable |
| Steady traffic, a 503 every 3 seconds (simulated) | Throughput falls to 86% of standard in the first 45 seconds, 57% after five minutes, 34% after half an hour. Real clients on SDK 2.55: 83% and 50% for the first two |
| Many threads throttled at the same moment | 32 of 32 threads: slowest call about 7 s on SDK 2.52+ (6.5 to 7.9), about 63 s before (61 to 65) |
| Bursts after idle time (checkpoints), one 503 at a random moment (simulated) | +0.8 s (16 threads) to +1.5 s (32 threads) on average. Worst case with 32 threads: +9.5 s on SDK 2.52+, +55 s before |
| Same bursts, the 503 in the first second (simulated) | +3.6 s to +4.1 s on average. In a real replay a 3.3 s burst became 11 s |
| A fresh client whose first answer is a 503 | 32 threads: about 10 s on SDK 2.52+ (7 to 11.5), 64 s before in 17 of 22 runs (7 to 12 s in the others) |
Two ways to retry
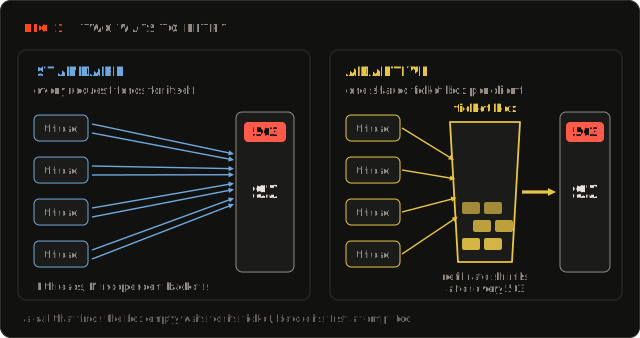
Standard treats every request as an island. A call that gets a 503 waits a random time (by default up to one second before the first retry, doubling after that, capped at 20 s) and tries again, on its own. That is fine while throttling is rare. Under sustained overload, many threads retrying independently keep pushing against the limit.
Adaptive keeps all of that and adds a client-side rate limiter shared by every call the client makes. After a 503 the whole client slows down, not just the request that got it. The AWS SDK reference guide is blunt about the price: adaptive mode “can delay or block the initial request, not just retries”, it “is not recommended as a general default”, and its advice is: “Use standard mode unless you have a specific reason to choose another mode.” The mode it suggests adaptive for is “single-resource, throttling-heavy, latency-tolerant”.
The ticket box in five rules
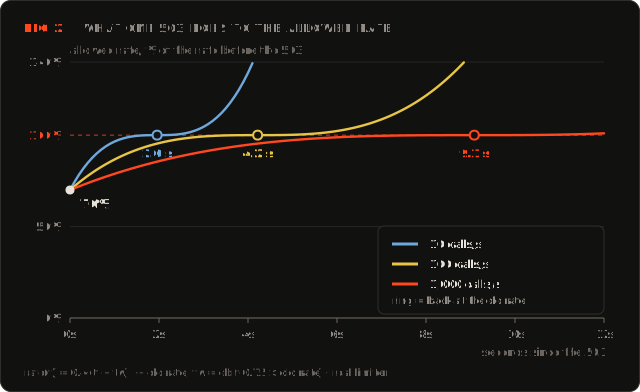
The limiter is a token bucket whose refill rate is steered by the algorithm behind TCP’s CUBIC. I read the SDK source and tested each rule against the real class:
- Rule 1, dormant until the first 503. Before the first 503 that will be retried, the box does nothing. After that it stays on for the life of the client.
- Rule 2, every attempt takes a ticket, first tries and retries alike. The SDK uses one scope (
GLOBAL) per client, so reads, writes, lists and deletes share one box. Two clients built from the same retry strategy share it too; I tested a sync and an async client. - Rule 3, a 503 cuts the refill rate to 70% of what you were sending, not of what S3 can take. 503s in a row compound (0.7, 0.49, 0.34, …) down to a floor of 0.5 tickets per second: one call every two seconds.
- Rule 4, success grows the rate back on a cubic curve, slowly at first and then faster. The time to get back is cbrt(0.75 × rate) seconds: 2.0 s at 10 calls/s, 4.2 s at 100, 9.1 s at 1,000.
- Rule 5, an empty box means waiting, before the first attempt as well. There is no upper bound on the wait, and nothing about the constants is configurable.
You can watch rule 3 and the floor happen in a dozen lines. The classes live in software.amazon.awssdk.retries.internal.ratelimiter: SDK-internal, fine for an experiment and not for production code. The output is identical on SDK 2.44.4 and 2.55.11:
// simulated clock, in seconds
double[] now = {0};
RateLimiterClock clock = () -> now[0];
RateLimiterTokenBucket box = RateLimiterTokenBucketStore.builder()
        .clock(clock).build().tokenBucketForScope("GLOBAL");

// 15 s of healthy traffic at 100 calls/s
for (int i = 0; i < 1500; i++) {
    now[0] = i / 100.0;
    box.updateRateAfterSuccess();
}
// S3 answers 15 calls with 503 at the same instant
for (int k = 1; k <= 15; k++) {
    System.out.printf("503 #%2d -> allowed rate %6.2f calls/s%n",
            k, box.updateRateAfterThrottling().fillRate());
}
503 # 1 -> allowed rate 70.00 calls/s
503 # 2 -> allowed rate 49.00 calls/s
503 # 3 -> allowed rate 34.30 calls/s
...
503 #14 -> allowed rate 0.68 calls/s
503 #15 -> allowed rate 0.50 calls/sTwo details decide most of what follows. First, the rate the limiter cuts is a measurement of what you sent: a smoothed count of responses per half second, updated only when a response arrives. After a quiet period it has forgotten your rate. Second, that measurement starts at about zero, so a 503 in the first half second of a client’s life cuts a rate of nothing and lands on the floor.
What AWS fixed in 2.52.0
Up to SDK 2.51, a call that found the box empty was handed a fixed wait at that moment, computed from the refill rate of that moment and never revisited. Put 32 threads in front of a box that has just dropped to the floor and the last one is told to wait about 64 seconds, even if the rate recovers a second later. This limiter has been in the SDK since 2.26.0 (June 2024), and its source did not change until the fix.
The fix was merged on August 11, 2026 (pull request #7197) and first shipped in 2.52.0. The changelog reads: “Previously, the computed rate limit was overly aggressive, potentially allowing a request rate much lower than what the service allows, and was unstable, varying over time even when the service’s allowed throughput was constant.” Since then, waiting callers sit in a FIFO queue and are served at the current rate.
I ran identical probe code against SDK 2.44.4 and 2.55.11. Same single-shot scenarios, real clients, median of 5 to 22 runs (for the old SDK in the last row the full range, because a median would hide the spread):
| standard | adaptive, SDK 2.51 and older | adaptive, SDK 2.52 and newer | Scenario |
|---|---|---|---|
| 3.5 s | 64.4 s | 10.5 s | Fresh client, 32 threads, first burst of 1,000 calls, one 503 |
| 1.2 s | 63 s | 7.0 s | 32 of 32 threads get a 503 at once: slowest call |
| 0.056 s | 32 s | 5.9 s | 16 threads throttled, then one async call on the same client |
| 391 calls/s | 0.6 to 194 calls/s | 108 calls/s | 96 threads against a store that admits 400 calls/s: goodput |
The ranges behind those numbers:
- Fresh client. On the old SDK 17 of 22 runs took 64.4 to 64.6 s and the other five 6.7 to 11.6 s. On the new SDK all 22 runs took 6.7 to 11.5 s.
- 32 of 32 threads throttled, slowest call. 61 to 65 s on the old SDK, 6.5 to 7.9 s on the new one (7 runs each).
- Async call after the sync threads were throttled. 26 to 32 s on the old SDK, 5.1 to 6.8 s on the new one, 0.052 to 0.057 s with standard retries (7 runs each).
- Goodput against the 400 calls/s store. 0.6 to 194 calls/s on the old SDK, with 5 of 15 runs locked up below one call per second, and 106.5 to 108.0 calls/s on the new one (8 runs).
What did not change is the rate math: the 0.7 cut, the cubic recovery, the floor, the dormant-then-always-on switch and the measured rate. I diffed the limiter between the two versions; only how callers wait and how the state is guarded differ. Where a number below carries no version tag, old and new behave alike.
One more switch you may have read about: AWS_NEW_RETRIES_2026=true, AWS’s opt-in for updated retry defaults. AWS says it changes “backoff timing, retry quota costs, and service-specific defaults”. In the 2.55.11 source it sets a 50 ms base delay instead of 100 ms and different retry quota costs, and the limiter code does not read it. My runs had it off.
What it costs
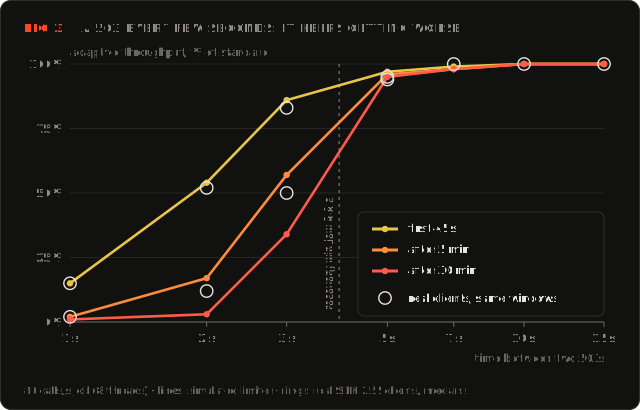
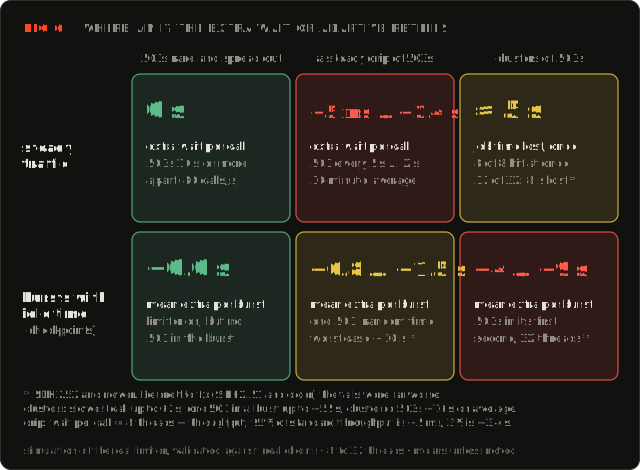
Every number comes from real SDK clients (3 retries, 100 ms and 1 s base delays, 20 s cap, 100 ms per call, 50 ms in the tests with an async call or a timeout) against the in-process fake S3, or from a simulator that drives the SDK’s real strategy and limiter classes with a simulated clock. I use the simulator where real time is too slow, such as half an hour of traffic, and I checked it against real clients on the steady drip, clusters, burst replays, the cold start and the hard wall. Numbers from the simulator alone are marked “simulated”, and Figure 3 shows the real measurements as rings. Real-client numbers move from run to run, on the old SDK by a lot, so they are medians with ranges over repeated runs.
A steady drip: it keeps getting worse
Take a steady job and let S3 answer one call with a 503 every few seconds. When the 503s are about as far apart as the recovery window, the limiter never gets back to full speed. And the damage grows with time, because the limiter’s measurement of your rate shrinks as it slows you down, which lets the next 503 cut an even smaller number. In a simulated 3-second drip against an 80 calls/s job, I sampled the real limiter: its measured rate went from 80 to 66 calls/s after 30 seconds of dripping and 28 after four and a half minutes, and settled near 23.
After half an hour (simulated), throughput relative to standard:
| 20 calls/s | 80 calls/s | 320 calls/s | One 503 every |
|---|---|---|---|
| 100% | 100% | 96% | 10 s |
| 100% | 95% | 54% | 5 s |
| 100% | 34% | 10% | 3 s |
| 13% | 3% | 1% | 2 s |
The cliff sits at about one recovery window, cbrt(0.75 × rate): 2.5 s at 20 calls/s, 3.9 s at 80, 6.2 s at 320. A faster job has a longer window, so it falls off the cliff at wider spacing. I simulated the old limiter only at 80 calls/s; there both generations behave alike, within a few percentage points.
Clusters: many threads throttled together
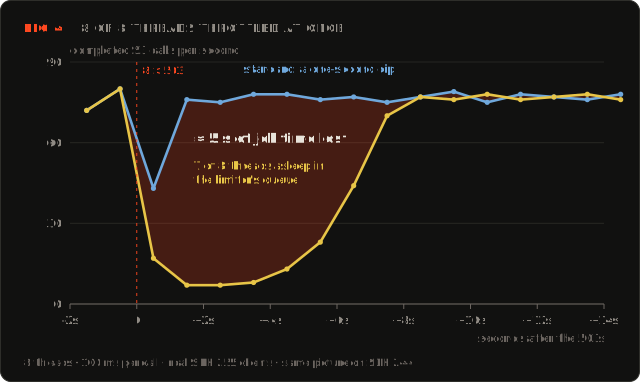
S3 rarely throttles one call at a time. When several in-flight calls get a 503 together, every one of them cuts the rate by 0.7, which is the compounding from rule 3. With 8 threads the cost is about five seconds of job time. With 32 threads all throttled at once, the rate hits the floor and callers queue behind it: the slowest call took about 63 s on SDK 2.44 (61 to 65 over 7 runs) and about 7 s on 2.55 (6.5 to 7.9), and in the 45 seconds after the event throughput was 80% below standard on 2.44 (72 to 87%) and 17% below on 2.55 (17 to 20%).
Bursts after idle time: the limiter forgets
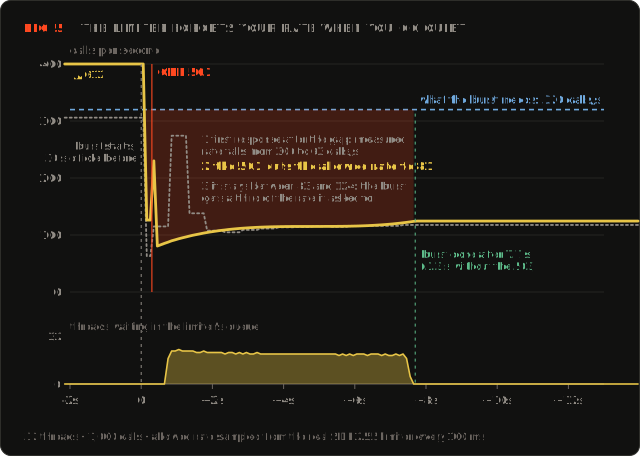
Checkpoints, micro-batches and nightly loads are bursts with idle gaps, and idle gaps are what the limiter handles worst. Figure 5 is a real client with the limiter sampled every 100 ms. It had learned 306 calls/s. The first response of the next burst drags that to 63, and a moment later the measurement is back at only 115. A 503 then cuts that too-low number to 81. For the rest of the burst the allowed rate never gets above 124 calls/s, about a third of the 320 it asks for, so the burst takes 7.7 s instead of 3.3. Over 12 runs, the same single 503 made that burst take 5.8 to 10.8 s on 2.55 and 5.7 to 11.1 s on 2.44 (median 10.5 and 10.6 s).
If a 503 hits every burst after 30 s of idle, the later bursts take about 11 s on both generations (median of 10 bursts: 11.2 s on 2.55 and 11.4 s on 2.44, range 5.8 to 12.1 s), against 3.3 s for standard. In simulation, one 503 at a random moment of a 32-thread burst costs +1.5 s on average, with the worst case at +9.5 s on 2.52+ and +55 s before; in the first second of the burst, +4.1 s on average. If the limiter was switched on earlier and no 503 comes inside the burst, nothing is lost (+0.0 s).
By AWS’s own description, 503s appear while S3 scales to a new, higher request rate and “dissipate when the scaling is complete”. A burst after idle time can be such a moment.
A fresh client: the first half second
A new client has no history, and the limiter’s rate buckets start at time zero, so for up to half a second after its first response the measured rate is about zero. A 503 in that window lands on the 0.5 calls/s floor whatever the real load. That is the 64 seconds in the lead. Over 22 fresh-client runs on SDK 2.44, 17 stalled for 64.4 to 64.6 s. In the other five the burst took 6.7 to 11.6 s, as if the limiter had already seen some responses: after 40 successful calls sent first it took 11.7 s in both runs I tried. Which of the two happens looks like a race between the first responses and the 503; I did not trace it. On SDK 2.55 the same burst took 6.7 to 11.5 s over 22 runs. With 8 threads whose first call is a 503, SDK 2.44 made seven threads wait 4 to 16 s and 2.55 made all seven wait 4 s; calls completed in the first 40 s were about 2,350 and 2,680, against about 3,060 for standard.
Fresh clients appear at every JVM start, every failover and every new client object. A restart can also be the moment when many of them ask S3 for a lot at once.
Where am I?
What you get in return
None of this makes adaptive retries wrong. It is a price, so what does it buy? To find out I replaced S3 with a toy that admits at most 400 calls per rolling second and answers the rest with 503, then sent more threads at it than it can serve. (AWS’s regression test for the fix uses the same kind of toy.) 96 threads at 100 ms per call is 960 calls/s of demand. One minute measured on real clients, median over 5 to 15 runs (goodput = successful calls per second). The old SDK row shows the full range instead, because a median would hide the spread:
| Goodput | Failed per 10k | Slowest call | Retry mode |
|---|---|---|---|
| 391/s | 4.3 | 7.1 s | standard, 3 retries |
| 391/s | 0 | 14 s | standard, 10 retries |
| 108/s | 0 | 7.7 s | adaptive, SDK 2.52+ |
| 0.6 to 194/s | 0 | 1 to 112 s | adaptive, SDK 2.51 and older |
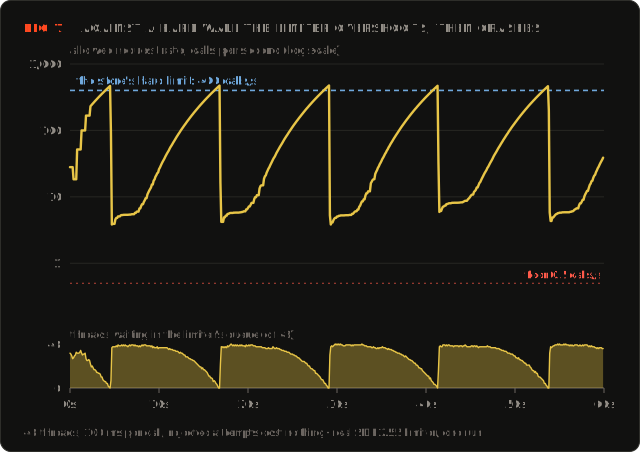
Read it honestly. Against this wall, adaptive on the fixed SDK removes the failures and cuts the 503 share from 17% to 1%, and the price is 72% of the throughput: 108 calls/s instead of 391. Figure 7, one run with 48 threads, shows why: the limiter climbs past the wall and meets a burst of 503s. Every one of them multiplies the rate by 0.7, and a drop from about 470 to 4 calls/s is about thirteen such cuts. It then spends about twelve seconds climbing back while nearly every thread waits. Standard with ten retries reached zero failures at full goodput too, for a longer worst call.
The old SDK row is not a typo. On SDK 2.51 and older this test was a lottery: 15 runs of the same command gave anything from 0.6 to 194 calls/s. In 5 of them the limiter locked the callers into waits of 75 to 99 s and delivered less than one call per second, in 2 more it got 24 and 28 (waits up to 112 s), in the other 8 it got 84 to 194. Having the machine to itself did not prevent it: 3 of 10 such runs locked up. With 128 threads, run only while the machine was busy, it locked up in 4 of 5 runs. In all 15 runs the old limiter protected the store, with under 0.1% of the attempts answered 503 against 17% for standard. What varied was the price. The fixed SDK gave 106.5 to 108.0 calls/s in all 8 runs, with 1.0 to 1.1% of the attempts answered 503.
Real S3 is not a wall. It scales, and AWS says the 503s fade when it has. So this is the harshest test for adaptive’s throughput and the kindest for its caution. What I did not measure is what AWS recommends adaptive for: a client against a single throttled resource that should slow down by itself, and the lighter load that gives the service.
Your controls
| Knob | Effect | Measured |
|---|---|---|
| Retry mode | Standard or adaptive | Everything above |
| Max retries | More attempts, fewer failed calls, no shared state | Wall, 96 threads: 4 to 0 failed calls per 10,000 at unchanged goodput, slowest call 7 s to 14 s |
| Threads per client | Sets the queue length behind the limiter | At the floor each queued thread waits about two seconds more. Fresh client: 8 threads wait up to 16 s on SDK 2.51 and older and 4 s on 2.52+; 32 threads about 64 s when it stalls versus about 10 s |
| One client per resource | Separate ticket boxes | A second client stayed at 0.055 s while an async call on the first waited about 6 s on 2.52+ and about 32 s before |
| API call timeout | Bounds a wait and turns it into an error | 5 s timeout, 16 throttled calls: 10 to 13 failed after 5.0 s on both generations (7 runs each); standard failed none |
The timeout deserves a warning. It caps the stall by turning it into an exception, which is a different problem: in a pipeline an exception can fail a task or a checkpoint.
How to find out where you are
- Which SDK version? 2.52.0 or newer has the fixed limiter. Connectors often bundle their own SDK, so check the jar, not your build file. In the Java SDK,
AWS_RETRY_MODE=adaptive(orretry_modein the profile) selects the strategy I measured, in both 2.44 and 2.55. - How are your 503s spaced? Count
SlowDownanswers per client. Compare the typical gap with the recovery window for your call rate, and note the largest number within one second. - How many calls are in flight per client? That is the queue length.
- Is your traffic bursty? If your S3 traffic goes quiet between checkpoints, the idle-gap effect applies.
- Watch the maximum and p99 of the API call duration. It includes the limiter’s waits. Flipping the retry mode in a staging environment and comparing the two is a ten-minute experiment.
My rule of thumb
- Default to standard. AWS says the same. If failed calls are your problem, raise the retry count first: it is cheap, bounded and keeps no shared state.
- Choose adaptive deliberately. It fits a retry storm that standard cannot damp and a latency budget that can absorb waits. Then use SDK 2.52 or newer, one client per resource, few threads per client, and an alert on the maximum call duration.
- Do not switch it on globally because it sounds safer. It is not safer. It moves the risk from errors to latency.
What I did not measure
- Real S3 and a real network. The transport below the SDK is an in-process fake (no connection pool, no TLS, no real partition scaling). Everything above it is the real SDK code, including the retry stage, the response parsing and the real clock.
- The fleet-level benefit, where many clients protect one prefix.
- The SDK’s retry quota (the “circuit breaker”). It is on by default and was off in my runs, to isolate the limiter.
- Other SDKs and versions. I measured Java SDK v2, versions 2.44.4 and 2.55.11. Other AWS SDKs offer an adaptive mode too, but I did not test theirs.
- Higher layers. A connector or framework with its own retries stacks them on top.
The limiter itself is RateLimiterTokenBucket in the SDK repository (the 2.55.11 version differs in how callers wait). It is a few hundred lines, and well worth reading before you let it near a pipeline.